Overview
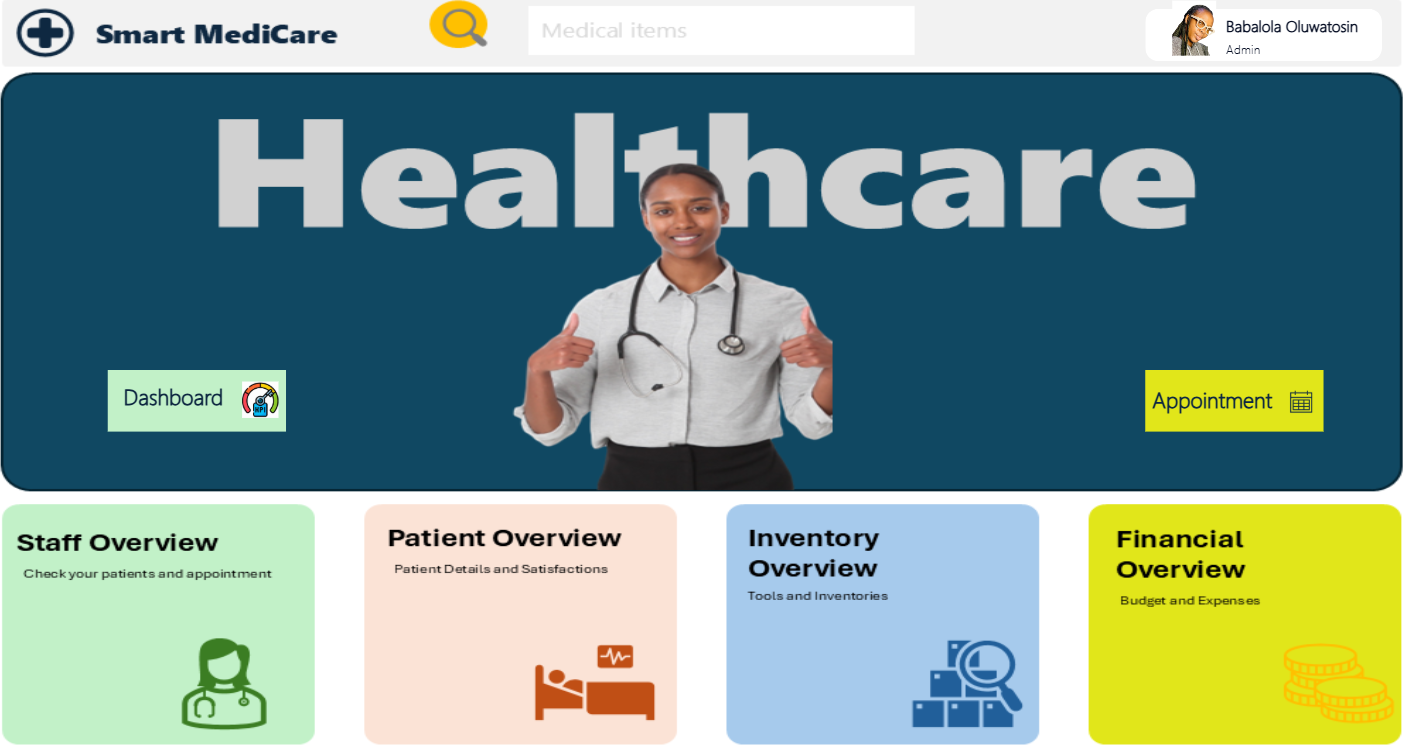
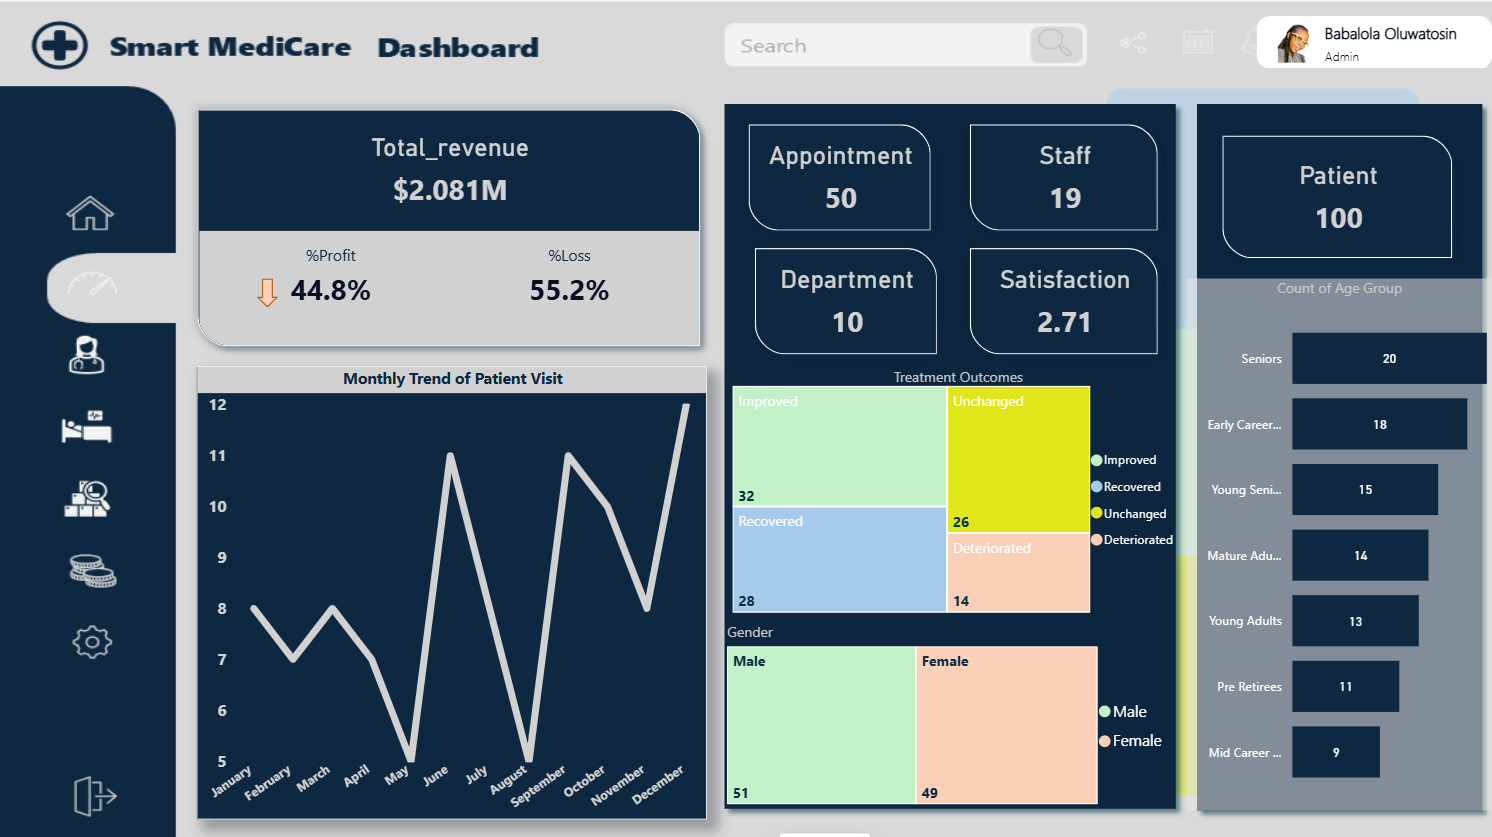
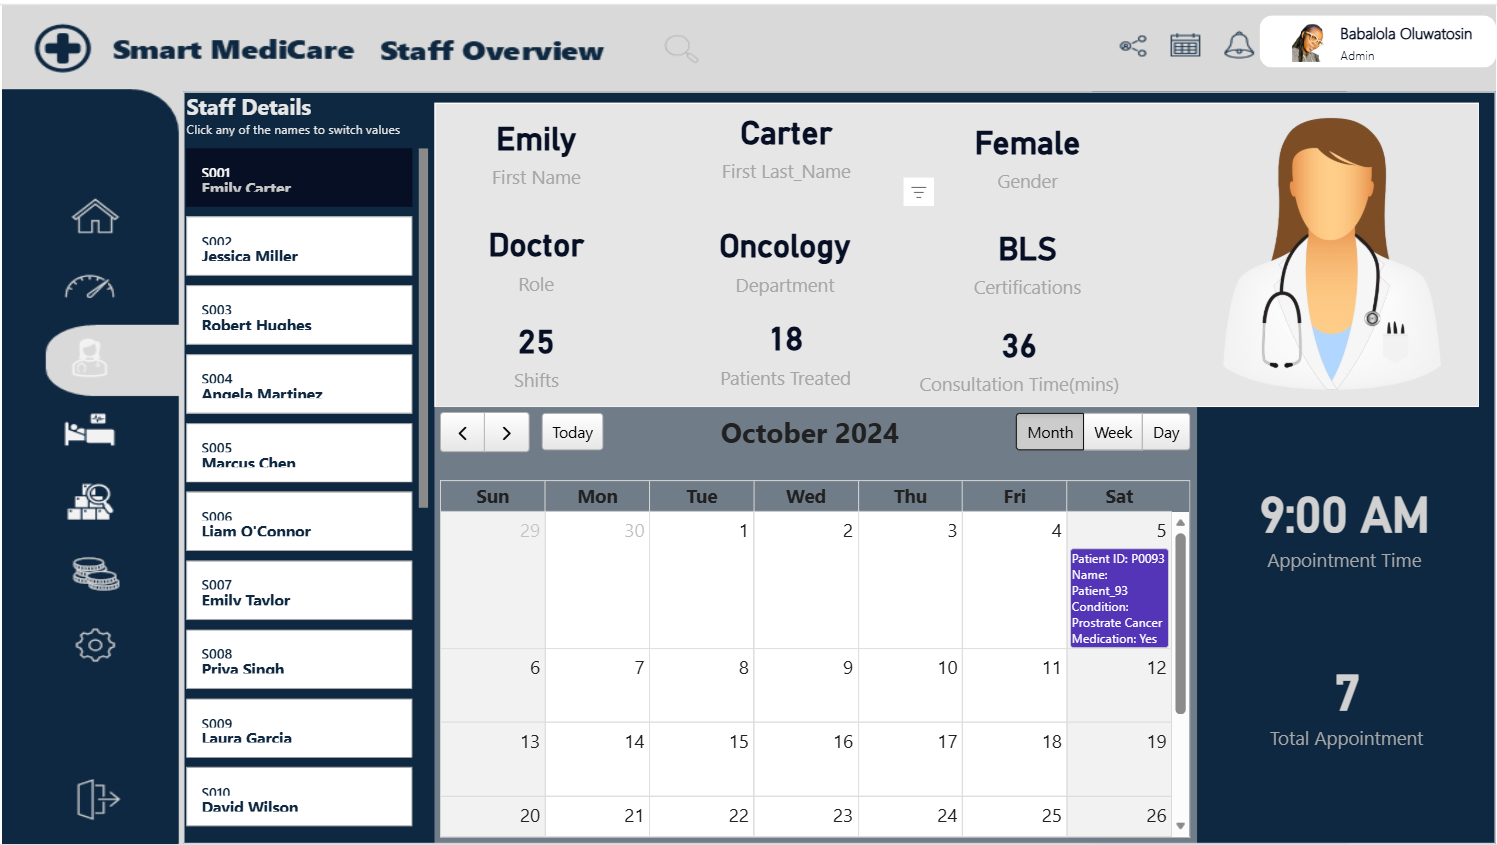
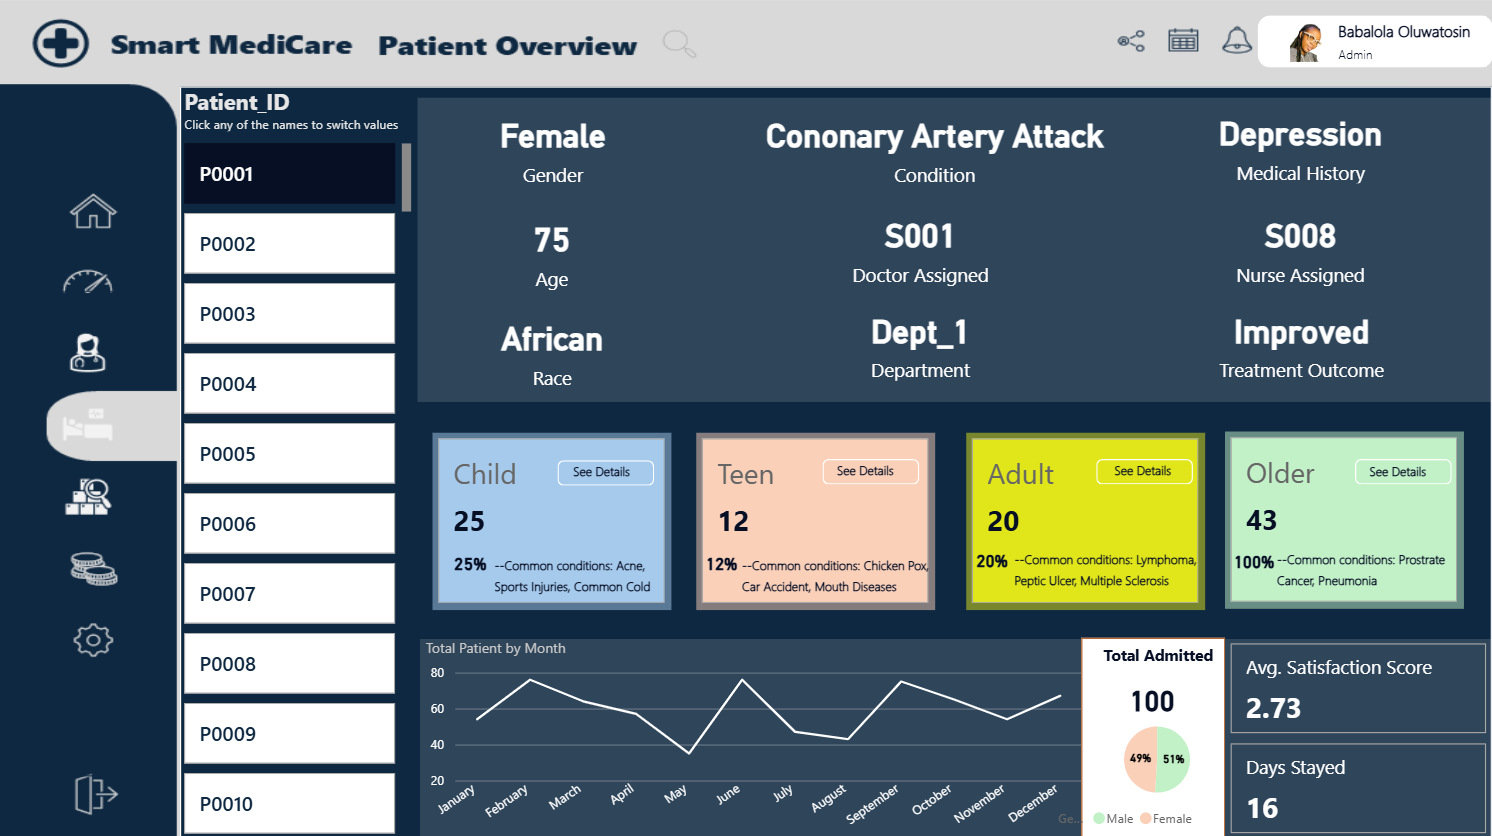
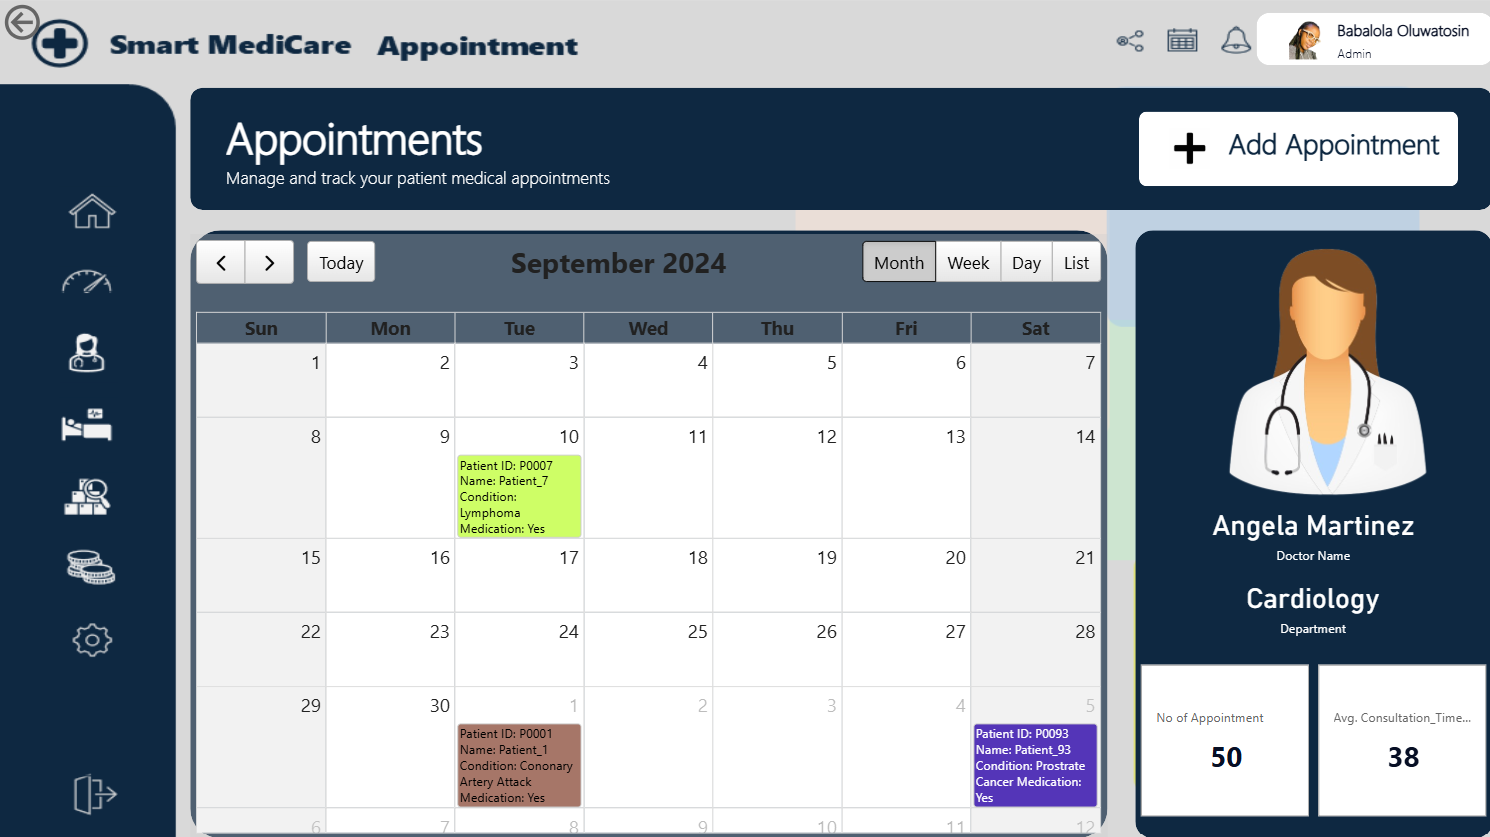
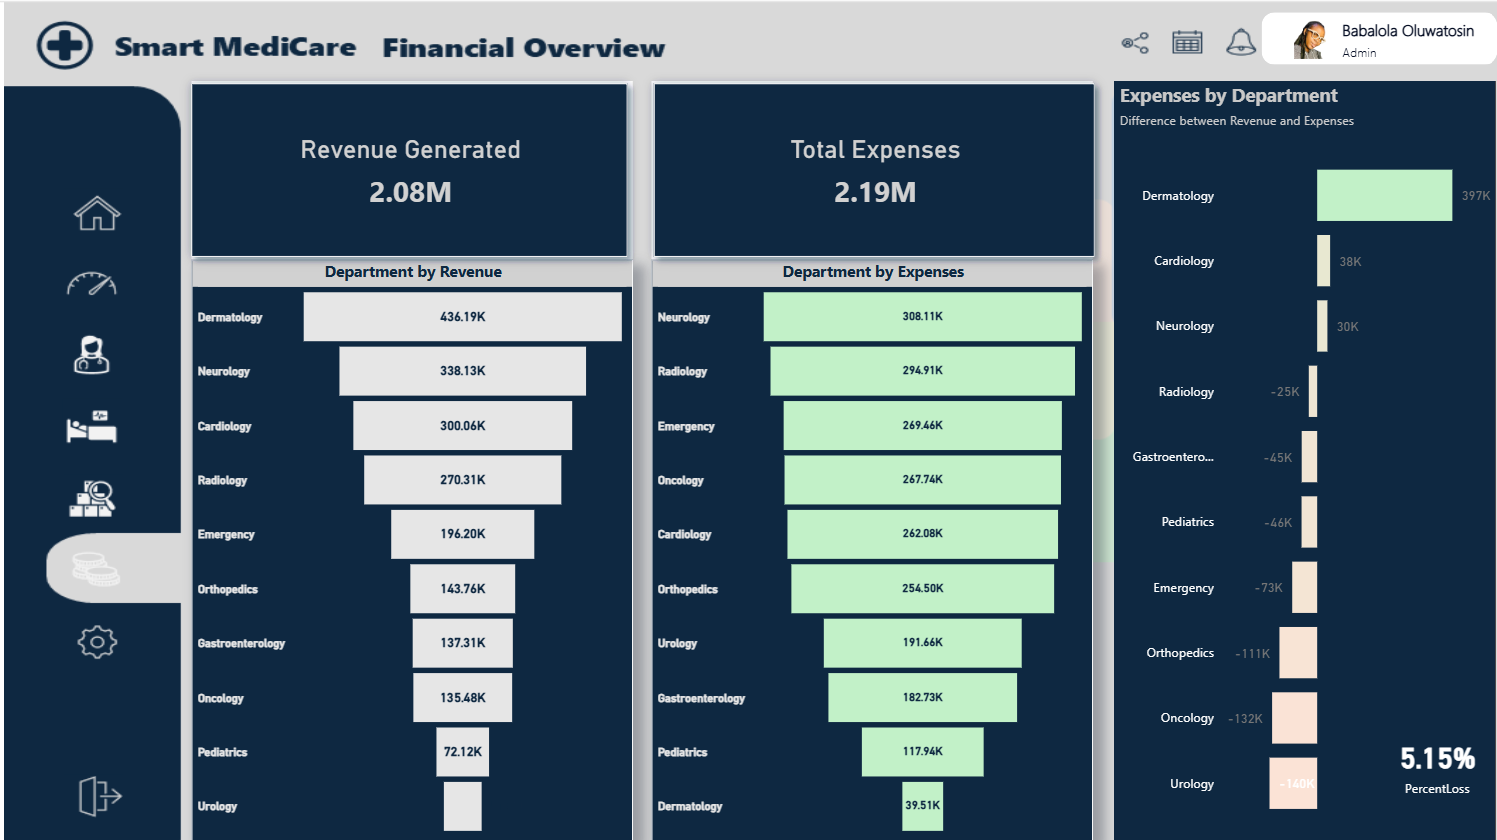
In collaboration with a skilled team of data analysts and a medical doctor, I led the development of a comprehensive Power BI solution to address critical inefficiencies in the healthcare system. The project delivered 7 integrated dashboards that give hospital administrators real-time insights across all major operational areas—from patient flow to financial health.
Challenge: The hospital lacked a unified view of operations, forcing leaders to make decisions based on outdated, siloed reports. This resulted in resource misallocation, bottlenecks in patient care, and missed revenue opportunities.
Solution: We built a data pipeline using Google Sheets as the data source, Azure DevOps for collaboration, and Power BI for visualization. The suite of 7 dashboards provides a holistic, real-time view of the hospital's performance.
Dashboard Breakdown

Key Outcomes
- Real-time decision-making: Hospital leaders can now monitor performance at a glance and take immediate action, rather than waiting for monthly reports.
- Resource optimization: Better staff allocation and inventory management reduced waste and improved patient care.
- Financial clarity: Department-level profit/loss visibility enabled strategic budget reallocation.
- Scalable framework: The dashboard structure is designed to adapt to other hospitals and healthcare settings across different countries.